Tuesday, May 24, 2022
Did Your Home Earn More than You Did in the Past Year?
Take two individuals for example, Karen Walker, a retail manager living in a rented apartment, and Jack Stone, an unemployed homeowner. According to the Case-Shiller Home Price Index, the median price of a U.S. home soared from $313,272 in February 2021 to $375,300 one year later.
Thus, Jack Stone, who stayed home and tended to normal home maintenance, earned $62,028 without leaving the comforts of home, except to cut the grass, and visit his bank to tap his home equity for living expenses. On the other hand, Karen Walker, the renter with no automobile, trekked to work via public transportation and earned approximately $11,000 less than Stone who stayed home and spent the day watching re-runs of Seinfeld.
Adding to Walker’s relative misery, Stone, owner of a three-year old Chevy Trailblazer, experienced a 2021-22 gain of roughly $6,000 as the resale value of the SUV jumped from $27,804 to $34,449. Thus, the unemployed Stone, via home and automobile ownership, was $18,000 wealthier at the end of the year than Walker who worked the full year, but owned neither home nor auto.
These income profiles show clearly how the easy money policies of the Federal Reserve, and the heavy federal spending during the pandemic widened the wealth gap between asset owners and non-owners. Ernie Goss
Saturday, May 21, 2022
Fed Rate Hikes Hurt Nasdaq More Than S&P, 1985-2022
Note that in September 2007, three months before the beginning of the Great Recession, the Federal Reserve’s short-term interest rate was 5.4% and the ratio of the Nasdaq to the S&P was 1.73. As the recession ensued, Fed rates declined to 0.2% and the ratio of indices climbed to 1.98. As rates moved even lower, the ratio rose to 2.40 in September 2016.
Over the full period, the correlation coefficient was a strong -0.62, indicating that as short-term interest rates fall, the ratio of the Nasdaq Index to the S&P rises. With the Federal Reserve slated to increase short-term interest rates by as much as two to three percentage points, this ratio should drop dramatically. This analysis does not encourage buying either, but if you just gotta buy—buy the S&P Exchange Traded Fund (SPY), not the Nasdaq ETF (QQQ).
Ernie Goss
Sunday, April 17, 2022
Biden’s Next Budget Punishes Success: Education, Innovation, and Productivity Are Discouraged
For the current fiscal year, the federal government will spend $6.011 trillion, or 26.1% of the total U.S. economy. Since the beginning of the pandemic, federal spending has soared by 47.5%, while the economy has inched up by only 7.6%. Biden’s proposed budget will push spending as a share of the economy to its highest level since economists began the process of national accounting.
To pay for this indulgence, Biden will the raise the tax on each additional $1,000 of income that high income individuals earn from $429 to $573. On top of this increase, the administration proposes a complex tax on the unrealized capital gains of high-net worth individuals including hard entrepreneurial founders. Under this plan, high income taxpayers with a gain in company stock values, or in the entrepreneur’s net worth would pay taxes on the gain even though the stock, or company, has not been sold. Mr. Biden would also raise the combined state and local corporate income tax rate from 25.8% to 32.3% and well beyond the 22.8% average for the 37 nations of the OEDC.
Not only will these actions punish entrepreneurs and investors financially, it will create bookkeeping nightmares for taxpayers while enlarging the IRS bureaucracy to handle the new tax law.
Biden’s Budget Blooper (BBB): more leisure, less work; more bureaucracy, less entrepreneurship.
Ernie Goss
Sunday, March 27, 2022
2017 Tax Reform and Remote Work Push Workers To Move to Low Income Tax Rate States
However, the passage of the 2017 federal tax reform bill, which limited the deduction of state and local taxes on federal income returns to $10,000 incentivized the migration of individuals from high to low-income tax rate states. Furthermore, Covid-19 freed workers to work remotely also encouraged workers to move from high to low-income tax rate states.
Not surprisingly, the 10 states with the highest income tax collections as a percent of GDP, excluding Kentucky and Oregon, lost a total of 1.8 million in population to migration between 2017 and 2021.
On the other hand, the 10 states with the lowest income tax collections as a percent of GDP, excluding Alaska, gained a total of 1.2 million in population to migration between 2017 and 2021. Tables 1 and 2 lists the highest 10 and lowest 10 income tax rate states using 2017 tax data. Ernie Goss
Sunday, February 27, 2022
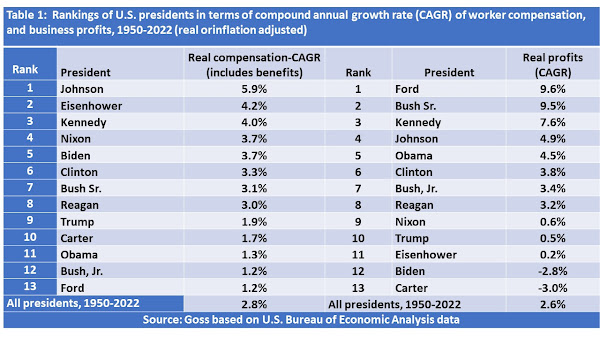
Which Presidents Serve Workers or Businesses? President Johnson: Best for Workers; President Ford: Best for Businesses
Even workers like Omaha manufacturing laborer Johnny Jones, who this month accepted a position at a competing food processing company for a 5% wage improvement, and a $500 bonus, is feeling the inflation pinch. Just this month his landlord raised his monthly rent by the national average increase of 14.1% or $141, and his family’s food bill soared by 6.3% (the national average), or approximately $43 monthly. And as he shops for a used auto to ferry him to his new job, he found the cost has skyrocketed by 37.3% to $19,000 over the past 12 months.
Jones, much like other Americans, is discovering what economists have been howling for over a year — that the rising costs of living has overwhelmed income gains for even those receiving raises. “So much for my raise and bonus,” complained Jones.
While Jones’ experience under Biden has not been great, expected presidential boasting, such as Biden’s, advances the more important question: which U.S. president has provided the most support for wage earners, and which president has been most supportive of businesses?
Table 1 below ranks each U.S. president since 1950 in terms inflation-adjusted growth in worker compensation (hourly wage plus benefits) and business profits during his time in office.
As listed among the 13 presidents since 1950, President Biden ranked fifth in terms of worker compensation growth, but twelfth in terms of business profit growth.
And contrary to the popular narrative that workers have lagged businesses in terms of economic returns, worker compensation expanded by 2.8% and business profits advanced by a smaller 2.6% under the 13 presidents in terms of CAGR 1960-2022.
Monday, January 10, 2022
Universities Drop Entrance Test Scores: Harvard and Berkeley Lead Discrimination Against Asian
However, even this strong Asian representation at top universities hides the discrimination against Asians in their admission decisions resulting in the current case before the Supreme Court (Students for Fair Admissions, Inc. V. President and Fellows of Harvard College). In June 2021, the justices deferred a decision in this case while they await an opinion from the Justice Department under President Joe Biden. Under Donald Trump, the department sided with the Asian American plaintiffs.
In an effort to hide the overt discrimination, Harvard and more than 1,240 of the nation’s 2,330 bachelor’s degree granting schools, including Creighton University, have ditched required standardized test scores as an element of admission decisions. Joining the avalanche against standardized test scores, U.S. News and World Report ranked test-blind colleges in its 2021 ratings.
Unfortunately by dropping standardized test scores, universities more easily heighten discrimination against high-achieving Asian and Asian American students by relying on high school grades and other less comparable metrics rather than standardized test scores. The irony is that these test scores were introduced in the early 20th Century to reduce discrimination in college admission.
Affirming the importance of Asian’s superior test score performance, Asians have secured 50.1% of jobs in Silicon Valley’s tech sector which is ten times their share of the U.S. population. Importantly, nearby Stanford maintains its use of standardized test scores in admission decisions.
We non-Asian citizens must, instead of abolishing test scores, engage the real enemy, which is the dumbing down of America’s education which produces students with low standardized test scores. Ernie Goss https://tinyurl.com/mr386h6j
Wednesday, December 22, 2021
Manchin Saves Biden from His 3Bs: Build Back Better or Budget Buster Blunder?
Despite Biden’s assertion that BBB would cost $0, the Congressional Budget Office (CBO), the official budget scorekeeper, estimated that even with budget gimmicks, BBB will expand the debt by $454.1 billion over the 2022-31 period.
BBB is on top of four major Trump and Biden 2020-21 stimulus programs and Federal Reserve (FED) expansion efforts.
These programs sprouted:
*A 2021 budget deficit of more than $2.77 trillion, the second highest on record. Primarily responsible for the ballooning deficit and debt were:
**2020’s $3.6 trillion stimulus,
**2021’s $1.9 trillion stimulus,
**and a yet-to-get rolling $1.2 trillion infrastructure program passed in 2021.
In order to support the spending packages, the FED purchased $4.5 trillion of U.S. Treasury bonds, and reduced short-term interest rates to 0% - ¼%. This had the impact of increasing the money supply by 37.5%, and boosting the annual inflation rate from less than 2% to over 6%.
Due to the massive 2020-21 overspending, the U.S. debt will exceed $30 trillion by the end of 2021 even before the rollout of the infrastructure program and BBB.
Who pays, or will pay, for this fiscal indulgence? There are those in the political class that assume that, due to ultra-low interest rates, and the FED money creation, this lavish party has no end. But as the Nixon Administration’s Chief Economic Advisor, Herb Stein, once said, “If something cannot go on forever, it will stop.”
Current interest payments on the federal debt average a bargain 1.77%. Should rates on the debt rise to the post-2000 average of 3.48%, each U.S. worker would have to belly-up approximately $3,200, or federal spending would have to be slashed by approximately $485 billion, or a combination of both poisons.
Senator Manchin of West Virginia, by stopping BBB in its tracks, has saved Biden from his Budget Buster Blunder.
Wednesday, November 24, 2021
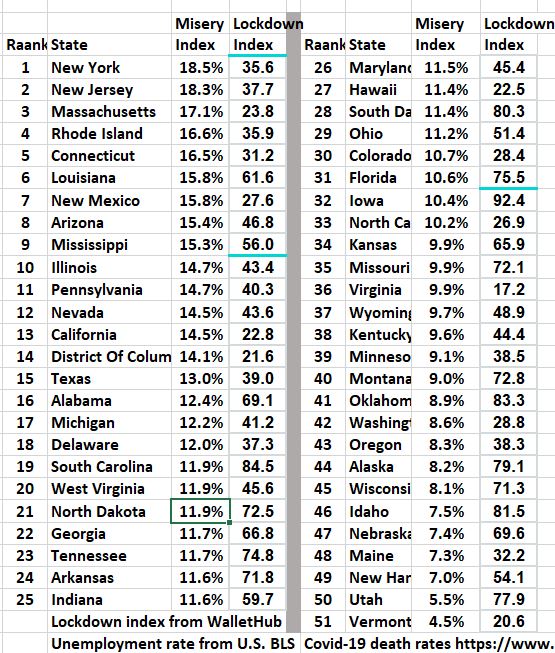
State Misery Indices (Updated): New York Most Miserable (Again), Utah Least Miserable
In the accompanying table, I calculate a State Misery Index by adding each state’s current Covid-19 deaths per capita to the state’s most recent percentage of job loss since one month prior to the pandemic, February 2020. In the table, lower rankings indicate higher degrees of misery in the state. As in the March 2021 Economic Trends Misery Index, New Yorkers, once again, ranked number one in terms of the highest degree of misery, while Utah residents experienced the lowest level of misery.
In terms of employment, Hawaii experienced the greatest job misery with a loss of 13.0% of non-farm jobs, while Utah suffered the least job misery with a job shortfall of 3.0%.
In terms of Covid-19 death misery, Mississippi suffered the greatest misery with the Covid-19 death rate at 3.4 deaths per 1,000 in population, while Vermont suffered the least Covid-19 death misery at 0.6 deaths per 1,000 population.
Surprisingly, the 25 states with the greatest degree of misery had a higher full vaccination rate of 56.3%, or slightly lower than the full vaccination rate of 57.3% for the 26 least miserable states.
Estimated correlation coefficients reveal that there is a negative correlation between vaccination rates and Covid-19 death rates (i.e. higher vaccination rates, lower Covid-19 deaths), and that there is a positive correlation between vaccination rates and job losses (i.e. higher vaccination rates, higher job losses). Ernie Goss
Sunday, September 26, 2021
More than six out of ten U.S households paid no federal income taxes in 2020 due to declines in income, and boosts in government subsidies that wiped out tax liabilities.
According to the Urban-Brookings Tax Policy Center, 106.8 million households escaped the federal income tax. This was up from 75.9 million in 2019. Brookings estimates the number of families owing no federal income taxes for 2021 will decline only slightly to 101.7 million, or 57.1%, owing a net $0.00.
And contrary to President’s Biden’s claim that high income workers are not paying their fair share, and should pay more, the data show the opposite. According to the Tax Policy Center, the top 20% of taxpayers paid 78% of federal income taxes in 2020, up from 68% in 2019. Furthermore, the top 1% of taxpayers paid 28% of taxes in 2020, up from 25% in 2019. And the trend over the decades has not been kind to families experiencing improving income levels by requiring them to pay a rapidly rising share of the federal income tax burden.
For example, in 1979, the top one-fifth of income earners paid a tax rate which was approximately three times that of the bottom one-fifth of income earners. But 38 years later, the top one-fifth of income earners paid 20 times the tax rate of the bottom quintile of tax payers.
Did shifting more of the income tax burden on to high income earners reduce income inequality over the period? Emphatically not!
Between 1979 and 2019, the degree of income inequality, as measured by the U.S. Census Bureau’s Gini Coefficient, increased from 0.404 to 0.484 (a higher index indicates greater income inequality). But more importantly, not only has shifting the burden of income taxes from low to high income households failed to reduce income inequality, it has reduced the incentive to increase earnings via higher education/training, higher hours worked, or other work activities linked to income that benefit both the household and society.
Accordingly, President Biden should reconsider his economic plan which punishes high income workers with a greater share of income tax burdens.
Ernie Goss
Saturday, September 04, 2021
The Six-Month President: From Ford to Biden
In the table below I rank each of the U.S. presidents beginning in 1975 to today according to growth in the overall economy, jobs and in inflation adjusted wages for the first 6 months of their presidency. Also to gauge whether each president got “America bank on track,” I compare each’s growth rate to the last 6 months of their predecessor.
GDP growth estimates listed in Table 1 indicate that President Carter experienced the top first 6 months with President Biden occupying a very close second. However, GDP growth under Biden suffered the largest negative turnaround with GDP declining by 5.6% between the last 6 months of Trump and the first 6 months of Biden.
Job growth estimates listed in Table 1 indicate that Biden experienced the top 6 month beginning with Carter capturing a close second. Additionally, Biden’s job growth was second only to Carter in terms of increases over the previous 6 months of the Trump by 0.59%.
Average inflation adjusted wage growth estimates listed in Table 1 show that Biden suffered the worst experience in the first six months among the 7 presidents with Trump experiencing the top average inflation adjusted wage expansion in the first 6 months of occupying the White House.
Despite the fact the president lacks even modest control over national economic measures in the first six months, pundits and the median continue to gauge and compare the president’s effectiveness by economic metrics over which it is argued that he and his predecessors have had little control. On these measures, President Biden has clearly not “rebuilt the economy.”
Thursday, July 22, 2021
Federal Government & Federal Reserve Supercharge the Economy: When & How Does It End?
With a compliant Congress, the Trump Administration increased an already bloated federal deficit by $1.22 trillion in one year. Not to be outdone, the Biden Administration expanded the deficit by more than $2.1 trillion in only six months. During this period of time, the FED slashed short term interest rates from 1.75% to 0.0% and purchased $4.3 trillion of federal debt and mortgage-backed securities in order to reduce long-term interest rates to record lows. During the pandemic, these actions increased the money supply by 28.1% and reduced the value of the U.S. dollar by 3.4%. So, what were some of the other outcomes?
Inflation and asset bubbles sprouted. The year-over-year consumer price index (CPI) climbed from a pre-pandemic 2.3% to the most recent reading of 5.5%, well above the FED’s pre-pandemic target of 2%. Additionally, the record high spending, low interest rates, and surging inflation have pushed investors into riskier bets. For example, in only 12 months, the Case-Shiller national home price index soared by 14.0%, the S&P stock index rocketed by 38.6%, bitcoin ballooned by 270.1%, and gold increased by 12.6%. Meantime, the overall U.S. economy barely nudged with the inflation-adjusted GDP actually down by 0.9%.
So, what’s the problem? The FED cannot sit idly by as inflation rips through the U.S. economy. Higher Inflation and interest rates will degrade U.S. stock prices forcing stocks to a more reasonable price to earnings ratio. Meanwhile, inflation will be supportive of cryptocurrency, gold and silver prices, even as higher interest rates moderate their gains.
Despite the evidence, the FED continues to plead their case that year-over-year CPI growth was just as high in July 2008. However, they fail to also acknowledge the FED’s short-term interest rate was 2.0% in July 2008 compared to today’s 0%.
Thus, there is currently much more FED stimulus for even higher inflation. To quote Eisenhower Administration economist Herb Stein, “If something can’t go on forever, it will stop.” So, what will stop or thwart these Goldilocks investment gains? Higher interest rates as early as Q4, 2021, that’s what!
Many economists, including yours truly, expect these out-sized gains to be flattened or even reversed when the FED begins raising long-term interest rates (tapering) as early as Q4, 2021. Strap on your financial seat belt-the economic landscape will get bumpy. Ernie Goss
Friday, June 25, 2021
Biden’s 'War on Work' Doubles LBJ’s 'War on Poverty': Who Pays for It? Today’s Youth!
In 1964, LBJ pushed the United States Congress to pass the Economic Opportunity Act, which opened the floodgate of 40 federal programs targeted against poverty. Much like LBJ’s explosive federal spending expansion, the New York Times portrayed Biden’s spending foray as "an attempt to expand the size and scope of federal engagement in Americans' daily lives." In his 4 years in office, LBJ advanced federal spending by 14% per year, and expanded welfare outlays by roughly $800 billion per year. Biden has almost doubled that growth in his first budget year alone by boosting federal spending by 26% compared to pre-pandemic levels.
Biden’s 2020 so-called stimulus spending of $1.9 trillion added $300 per week in unemployment pay on top of regular jobless benefits, plus $1,400 per individual in stimulus checks, and $3,000 per child in financial assistance (all discouraging work). In a recently completed study, Mulligan, Antoni, and Moore concluded that in 19 states, a household of four with two unemployed workers can receive $100,000 in equivalent pay without working (Committee to Unleash Prosperity, White Paper #8).
And who pays for this fiscal indulgence? Between 1964 and 1968, LBJ funded his War on Poverty by raising the nation’s federal deficit as a percent of GDP from 1.0% to 1.5%. Biden, to fund what is termed here as his War on Work, has proposed raising deficit spending as a percent of GDP from pre-pandemic 4.8% to approximately 9.9%, the highest since World War II.
Furthermore, Biden’s Plan would also push the debt held by the public (not counting internal debt) to 111.8% of GDP eclipsing the level suffered in the wake of World War II.
Ultimately the nation’s youth will pay for this overspending via either higher inflation, advancing interest rates and soaring taxes, or a combination of all three.
Ernie Goss
Wednesday, May 26, 2021
China’s GDP Surpasses U.S.’s: Who Loses and When?
At the 1971 Bretton Woods Agreement, the U.S. dollar was officially crowned the world’s reserve currency. Even without this official designation, due to the size of the U.S. economy, and its debt markets, the U.S. dollar was, and is, the global reserve currency. As a result of this status, other countries accumulate reserves of U.S. dollars equivalents instead of gold. But rather than holding U.S. dollars, these nations purchase and hold interest earning U.S. Treasury bonds. These purchases have the impact of reducing U.S. interest rates. Furthermore, these bond purchases strengthen the U.S. dollar making purchases of foreign products such as Paris vacations and German automobiles cheaper in price for U.S. consumers.
However, in 2015, the IMF awarded the Chinese yuan status as one of four reserve currencies with the dollar supreme. The IMF basket of reserve currencies currently includes the euro, the Japanese yen, the British pound, and U.S. dollar. Should China’s GDP surpass that of the U.S., and they abandon currency manipulation, there will be pressure from global investors to abandon the dollar and crown the yuan as THE global reserve currency.
The yuan replacing the dollar as THE global reserve would push U.S. interest rate much higher, increase borrowing costs for U.S. firms engaged in international trade, and boost U.S. consumer/business borrowing costs.
At this time, China’s interest rates on government debt are approximately two percentage points higher than the U.S.’s. Thus, the dollar losing its status as the global reserve currency could increase U.S. federal debt service by as much as two percentage points and cost U.S. taxpayers as much as $600 billion per year in interest payments, other factors unchanged.
Ernie Goss
Wednesday, April 21, 2021
Biden Taxes Will Reduce Global Competition, Slow Growth: Practice What You Preached Dr. Yellen
To pay for a portion of this exploding spending, the president has called for an increase in the corporate income tax rate from 21% to 28%, and a boost in the income tax rate on households making more than $400,000. The added corporate tax rate is on top of state the assessment of 44 states and D.C. that have corporate income taxes on the books ranging from North Carolina’s single rate of 2.5% to a top marginal rate of 11.5% in New Jersey.
An increase in the federal corporate tax rate to 28 percent would raise the U.S. federal-state combined tax rate to an average of almost 34% and would be the highest among the 37 OECD nations which have an average corporate rate of 22% with lowest rates for Ireland at 12.5%, and Switzerland at 8.5%. This increase would harm U.S. economic competitiveness and increase the cost of U.S. firms. The Tax Foundation estimated that the hike would reduce long-run GDP growth by approximately one-fourth, eliminate 159,000 jobs, and reduce wages by 0.7%.
But instead of engaging in global competition, the Biden Administration is attempting to coerce OECD members into raising their rates. To quote ex-academic economist, Federal Reserve Chairman, and current U.S. Treasury Secretary Janet Yellen, “Destructive tax competition will only end when enough major economies stop undercutting one another and agree to a global minimum tax.”
I guess she only believed in market-based economics and competition when she was teaching macroeconomics at the University of California-Berkley. Welcome to the 21st Century Dr. Yellen. The U.S. must compete in the global economy, not attempt to fix prices, and limit competition. This is not legal for companies in the U.S., and should be verboten for OECD nations.
Ernie Goss
Tuesday, March 23, 2021
Monday, February 22, 2021
Mainstreet Versus Wallstreet: Stocks Did Better Under Democrat Presidents (Workers Under Republicans)
Monday, January 25, 2021
Punishing Success by Raising Taxes: Biden’s Bite to Support Government Expansion
|
Table 1: Top tax rates for highest (rates are
for income tax rates only, and do not include other Biden increase such as
capital gains) |
|||
|
|
Current Top Income tax rate |
Biden addition |
New top tax rate |
|
1. California |
64.15% |
2.60% |
66.75% |
|
2. Hawaii |
61.85% |
2.60% |
64.45% |
|
3. New Jersey |
61.60% |
2.60% |
64.20% |
|
4. Oregon |
60.75% |
2.60% |
63.35% |
|
5. Minnesota |
60.70% |
2.60% |
63.30% |
|
6. D.C. |
59.80% |
2.60% |
62.40% |
|
7. New York |
59.67% |
2.60% |
62.27% |
|
8. Vermont |
59.60% |
2.60% |
62.20% |
|
9. Iowa |
59.38% |
2.60% |
61.98% |
|
10. Wisconsin |
58.50% |
2.60% |
61.10% |
|
Notes: Iowa’s income tax rate allows the
deductibility of federal income taxes and is thus somewhat lower than that
listed. |
|||
|
Table 2: Ten states with the greatest income
inequality |
||
|
State |
Total Current top tax rate |
2018 Gini coefficient |
|
1. District of Columbia |
59.80% |
0.524 |
|
2. New York |
59.67% |
0.513 |
|
3. Connecticut |
57.84% |
0.501 |
|
4. Louisiana |
56.85% |
0.494 |
|
5. California |
64.15% |
0.491 |
|
6. New Mexico |
55.75% |
0.489 |
|
7. Florida |
50.85% |
0.489 |
|
8. Massachusetts |
55.85% |
0.488 |
|
9. Alabama |
55.85% |
0.486 |
|
10. Arkansas |
57.45% |
0.485 |